With the end of January coming this week its time for the monthly overview of the portfolio.
Portfolio Value
The Portfolio is now valued at $3,321,13. Not including cash that I invested this month the portfolio has grown a modest 1.03% this month for a total of 33.98.
This Months Purchases
This month we had two deposits both being around $100.00 for a total January investment of $200.00. With this investment we were able to build current positions in five different stocks bringing our yearly dividend income up to $145.18 per year. The purchases are listed below.
Ticker Symbol
Number of Shares
Purchase Price
Total Cost
Date Purchased
F
2
$8.98
$17.97
January 24th, 2020
BAC
1
$33.78
$33.78
January 23rd, 2020
F
5
$9.06
$45.28
January 23rd, 2020
NRZ
1
$16.70
$16.70
January 17th, 2020
MAIN
2
$44.60
$89.20
January 17th, 2020
Stock Purchases for the month of January 2020.
Dividend Payments
This month we recieved a total of 6 dividend payments for a total of $8.20. The payments are as follows:
Ticker Symbol
Number of Shares
Dividend per Share
Total Dividend
Date Recieved
NRZ
2
$0.50
$1.00
January 31st
DIS
1
$0.88
$0.88
January 17th
STAG
1
$0.12
$0.12
January 15th
EPR
9
$0.375
$3.38
January 15th
MAIN
6
$0.20
$1.23
January 15th
WMT
3
$0.53
$1.59
January 2nd
That concludes this months update. If there is anything that I should add in future updates please be sure to let me know either in the comments or messaging me.
Before, we get started i’m just going to say this isn’t going to be an article about in depth technical analysis. This article is going to be about understanding basic patterns to ensure your getting the best price possible on your purchase.
The Overall Trend
The first aspect to consider when analyzing a stock is the overall trend or direction that its heading. I don’t know about you but I don’t like putting my money in things that are going down in value. If i’m going to spend my hard earned cash on an investment I want to make sure its going to provide me with more value in the future. Now, when doing this there are 3 different trends you should be able to recognize.
Upward Trend
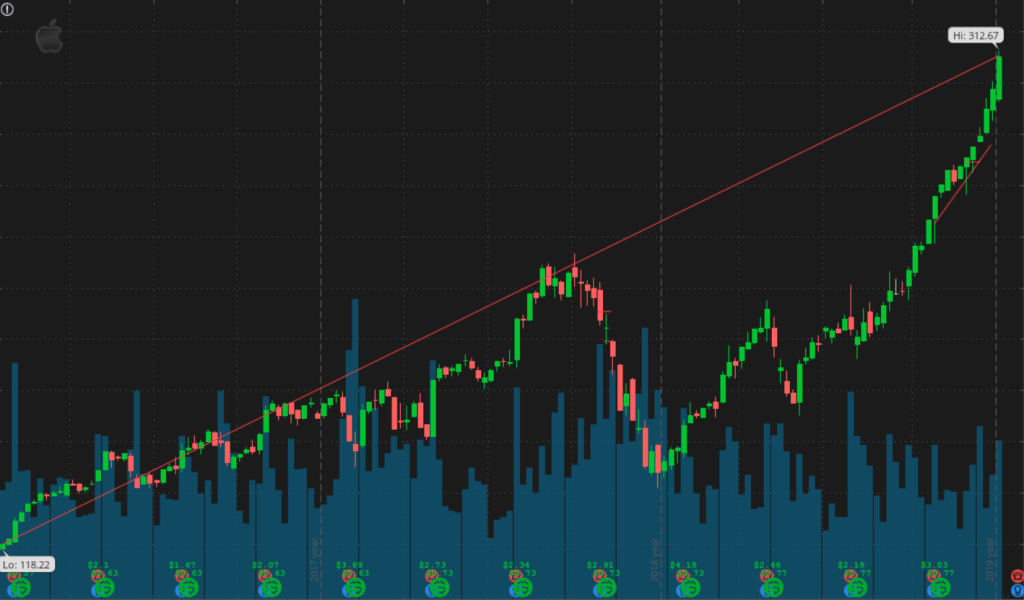
The first trend you should be able to recognize and the trend you should want to put your money into is an upward trend. I am a dividend growth investor so whenever I purchase a stock i’m in it for the long haul. Therefore, I’m not concerned with the short term up and down swings of a stock. So, in order to analyze a trend I usually use the 5 year charts or longer if available. The best example of this type of trend is Apple Inc. (AAPL).
Apple Inc. Stock with Overall Trend Line
As you can see the ending price is significantly higher then the starting price, which correlates to more money in your pocket. However, along the way you can see that there are many short term down swings in the stock price but it always bounces back due to the overall trend. The red line is referred to as a trend line and stocks tend to stick close to there trend lines if correctly calculated. These types of stock are safe keepers of your investment money.
Horizontal Trading
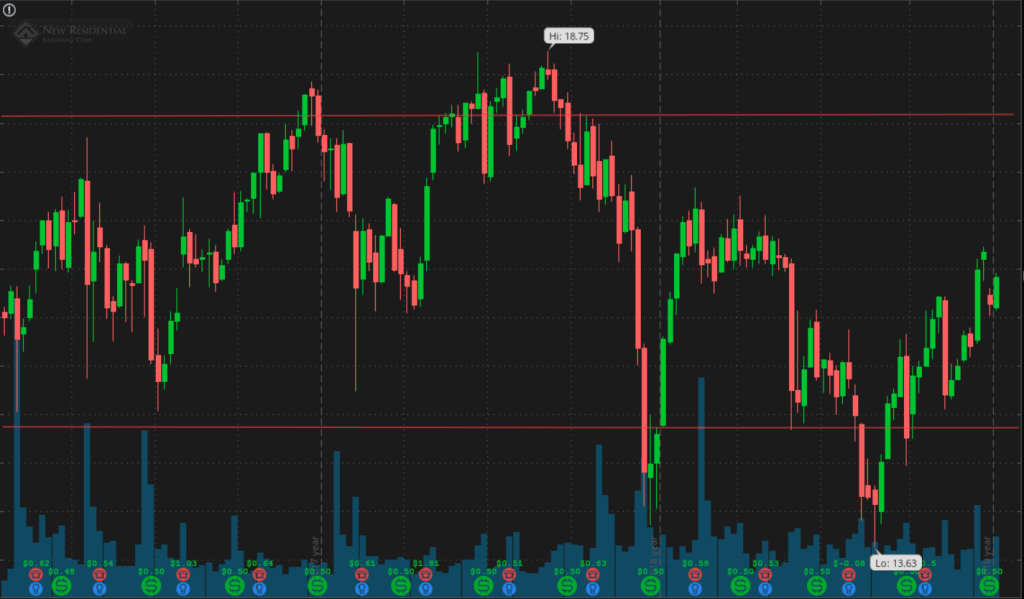
The next type of overall trend you should be able to identify is horizontal trading. This is when a stock moves up to a resistance line and then falls to a support line. The stock keeps oscillating between lines until some event triggers it to break pattern. This type of stock is also a good bet for your investment money. By identifying the support line or low point the stock bounces off of you can buy in and then by identifying the resistance point or high point you can sell your position before the stock falls. The type of investment is also good for dividend investors. While your initial capital may not be growing, you will be receiving regularly scheduled dividend payments, which in turn add to your return on investment. For this example, we will take a look at New Residential Investment Trust (NRZ).
New Residential Investment Trust with Support and Resistance Lines Identified.
As you can see from the chart, the stock price appears to bounce between the two red lines. While it may peak briefly over the line or fall below the line it quickly corrects itself and begins trading back between the lines. I personally would still put money into a stock that is trading horizontally as long as the dividend payments stay consistent.
The Downward trend
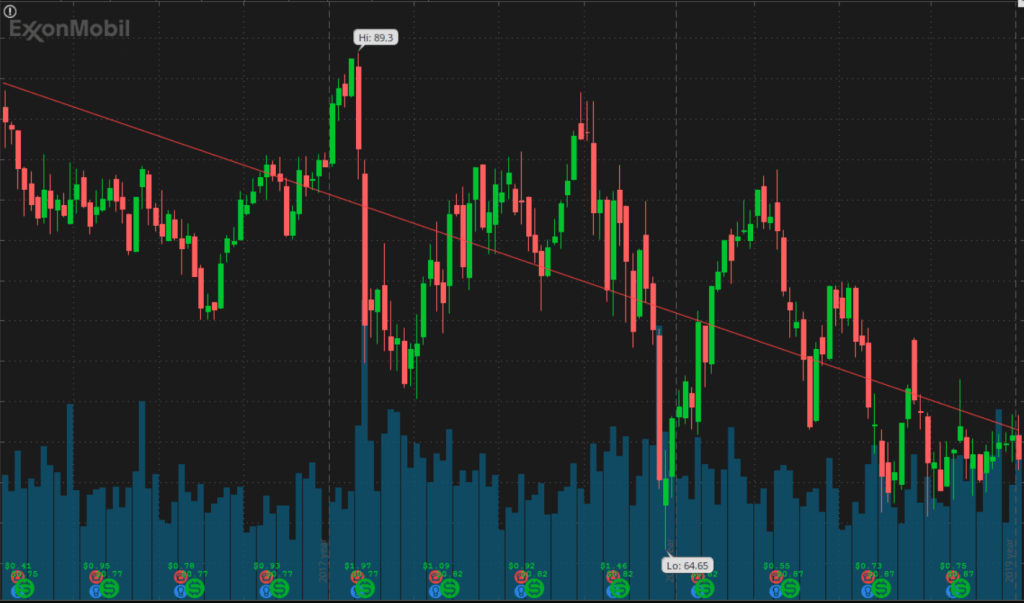
The last trend you should be able to identify is a downward trend. Whenever you see this type of trend, run the other way. Putting money into this kind of investment is like buying a lottery ticket that you know is going to lose. This is different then buying a stock that has dropped and you purchase some at a discount price because you know it will bounce. If a stock is exhibiting a downward trend then it may oscillate up and down over time but over the long term it generally loses value. Although, receiving dividend payments on this kind of stock will help to offset the depreciation in capital these investments just aren’t a good idea. For this example we will use Exxon Mobile (XOM).
Exxon Mobile with Trendline added.
As you can tell over time the share price for XOM has dropped, representing a depreciation in capital. However, full disclose I do own 2 shares of XOM and the reasoning behind that is if you look at the very end of the chart you can see consolidation and it beginning to bounce, indicating a bottom. Therefore, a downward trend can turn into a prime buying opportunity if a bottom is discovered.
Disclaimer: I am not a financial professional and all of the above are opinions of myself. For Financial advise consult a finance professional. I hold positions in all of the above mentioned stocks.